While the final results of the 2020 US presidential election are long overdue, the media and social networks see countless maps and graphics scrolling to analyze the ballot. And some representations have turned into weapons of a very political battle. Evidenced by a visual that has gone viral: a map of the results of the 2016 presidential election, sometimes represented by American counties, sometimes according to the number of voters.
>> American election: the latest information in our direct
“Land doesn’t vote. People do”, indicates the visual produced by data scientist Karim Douieb
and shared thousands of times. Understand : “The territory does not vote. People do”. In other words, the color red spread over widely populated territories is far from proving the popular support that Trump has enjoyed, and it is more interesting, and less biased, to represent the results by the number of votes. received.I am not the first one and I surely won't be the last one to point out that traditional electoral maps are a misleading way to represent the outcome of an election. This is something you can't stress enough: https://t.co/euqDAvTvmU pic.twitter.com/KCEGigmaZu
— Karim Douïeb (@karim_douieb) February 22, 2020
>> American election: the live results map
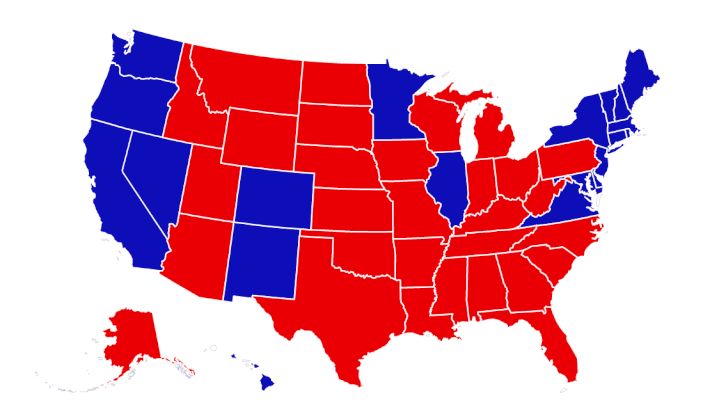
In fact, this map of county results has obsessed Donald Trump for exactly four years. This image where the vast majority of American territory is tinged with red, he even wanted it to be displayed in the corridors of the White House, as a journalist from the conservative Fox News channel had observed in May 2017.
And to say that this is an obsession for Trump. According to the New York Times, the president kept a stack of these trompe-l’œil cards in reserve, which he distributed to his visitors praising his good results, underlining in passing how the polls had gone astray. In April 2017, as the symbolic date of his first 100 days in office approached, Donald Trump again gave this card to journalists interviewing him. “We were talking about Chinese President Xi and suddenly he kind of interrupted himself, and gave us this card.”, tells Jeff Mason, correspondent of the Reuters agency at the White House. At the same time, the president intimated Washington Post to display this card on its front page. What the newspaper refused.
Less than a year later, Donald Trump is setting the scene again. “Such a beautiful card”, tweete-t-il in response to an Internet user who republishes the image. And in October 2019, the president, targeted by an impeachment inquiry, still tweets the image of a predominantly red country, along with a comment: “Try to remove this” .
This map was also widely circulated by conservative media, reputed to be pro-Trump, such as Fox News, Breitbart and Infowars, as noted by the American journalist Alberto Cairo, in his book How charts lie (How the charts lie, éd. W.W. Norton & Company, 2019). Far-right activist Jack Posobiec even went so far as to use it on the cover of his book Citizens for Trump (ed. CreateSpace Independent Publishing Platform, 2017).
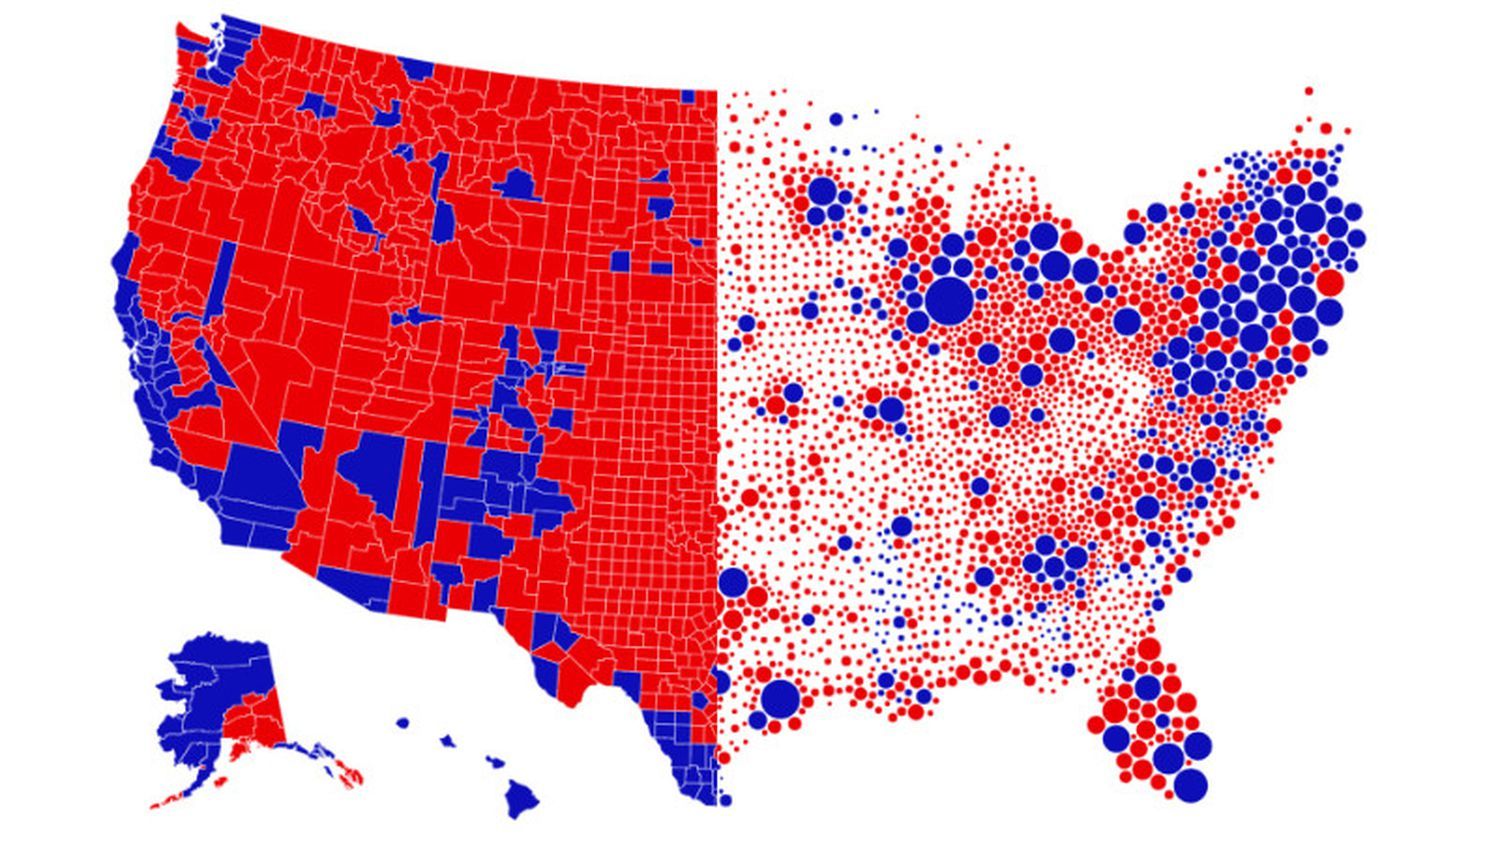
The problem with this card? Donald Trump and his supporters use it to illustrate supposed popular support, namely the number of people who voted for the Republican candidate. However, the map actually represents the counties in which Donald Trump came first in 2016. And the information transmitted is quite different: it is true that Trump won 84.5% of the counties, but only 47% of the votes. In other words, the outgoing president has taken over sparsely populated counties.
To get a better idea of the distribution of the number of people who voted in 2016 for Republican Donald Trump and Democrat Hillary Clinton, we must resize each county according to the number of votes. On the map below, the circles represent the counties and the size of each is proportional to the number of votes of the candidate who wins.
The popular success of Donald Trump then appears much less obvious. And for good reason: in reality, at the national level, Hillary Clinton won more votes in 2016 than Donald Trump.
For the past four years, maps of the 2016 results by county have been regularly shared on social media by Democrats and Republicans to poke fun at each other. Here, we represent the territories, there the number of votes. But in reality, neither side chooses the most relevant illustration to represent the results of the 2016 election.
In the United States, it is not necessary to obtain a majority of the votes at the national level to be elected. The American presidential ballot is indirect: citizens vote in their respective state for the electorate who is responsible for appointing the new president after the elections. There are a total of 538 electors, distributed among states according to their size and population. Montana and Wyoming have only three, while Texas and California have 38 and 55 respectively. In each state, the candidate who obtains the most votes wins all of his or her electors: we talk of “winner takes all” (“the winner takes it all”). And you have to have a majority of large voters, at least 270, to win the election.
So to better visualize the results of an American presidential election, it is not a question of representing the popular vote, but rather of visualizing the States with a size adjusted according to their number of large voters. Here is an example of a relevant visualization below, with the results of the 2016 election, carried out by Karim Douieb.
*We just want readers to access information more quickly and easily with other multilingual content, instead of information only available in a certain language.
*We always respect the copyright of the content of the author and always include the original link of the source article.If the author disagrees, just leave the report below the article, the article will be edited or deleted at the request of the author. Thanks very much! Best regards!
These were the details of the news how Donald Trump has been handling a trompe-l’oeil card for four... for this day. We hope that we have succeeded by giving you the full details and information. To follow all our news, you can subscribe to the alerts system or to one of our different systems to provide you with all that is new.
It is also worth noting that the original news has been published and is available at en24news and the editorial team at AlKhaleej Today has confirmed it and it has been modified, and it may have been completely transferred or quoted from it and you can read and follow this news from its main source.


